One of the most common problems of a VPS server is the CPU usage. Of course, each process that runs on the machine requires CPU resources.
The most common measure of CPU usage on Linux is the server load. Basically, the bigger the load value, the more your CPU is used.
To see the current server load, you can use the uptime command:
[root@bubble ~]# uptime

15:31:07 up 19 days, 8:25, 1 user, load average: 0.11, 0.09, 0.02
The three values in load average represent the system load during the last one-, five-, and fifteen-minute periods. Simple, right?
Another useful tool if you have multiple users on your server, is the w command:
[root@bubble ~]# w

15:33:55 up 19 days, 8:28, 2 users, load average: 0.17, 0.11, 0.03

USER TTY FROM LOGIN@ IDLE JCPU PCPU WHAT

root pts/0 5-12-95-183.resi 14:03 0.00s 0.38s 0.00s w

root pts/1 5-12-95-183.resi 15:33 3.00s 0.00s 0.00s bash
This simple command allows you to see the CPU usage for each individual session – just in case someone is killing the platform by re-compiling the kernel during peak-hour.
Of course, just knowing that your server is busy usually is not that useful, so you will probably want to also know which processes are using the most CPU resources.
To see which processes are running on the platform, you can use the handy ps command:
[root@bubble ~]# ps aux

USER PID %CPU %MEM VSZ RSS TTY STAT START TIME COMMAND

root 1 0.0 0.0 19232 1452 ? Ss 2013 0:03 init

root 2 0.0 0.0 0 0 ? S 2013 0:00 [kthreadd/296]

root 3 0.0 0.0 0 0 ? S 2013 0:00 [khelper/296]

root 857 0.0 0.0 64308 916 ? Ss 2013 0:00 /usr/sbin/saslauthd -m /var/run/saslauthd -a pam -n 2

root 860 0.0 0.0 64308 652 ? S 2013 0:00 /usr/sbin/saslauthd -m /var/run/saslauthd -a pam -n 2

root 1312 0.0 0.0 10644 468 ? S<s 2013 0:00 /sbin/udevd -d

root 1482 0.0 0.0 20496 1284 ? Ss 2013 0:07 crond

root 1499 0.0 0.1 183940 4644 ? Sl 2013 0:30 /sbin/rsyslogd -i /var/run/syslogd.pid -c 5

root 1546 0.0 0.0 22184 948 ? Ss 2013 0:00 xinetd -stayalive -pidfile /var/run/xinetd.pid

postfix 4257 0.0 0.0 82360 4056 ? S Jan02 0:03 qmgr -l -t fifo -u

root 5349 0.0 0.0 66612 1224 ? Ss 2013 0:13 /usr/sbin/sshd
As you can see the list is quite big, so you might want to filter it using grep:
[root@bubble ~]# ps aux | grep nginx

nginx 28804 0.5 3.4 1112784 146512 ? S 14:32 0:21 php-fpm: pool www

nginx 28805 0.5 3.7 1124208 158420 ? S 14:32 0:24 php-fpm: pool www

nginx 28806 0.6 3.6 1017464 154084 ? S 14:32 0:27 php-fpm: pool www

nginx 28807 0.5 3.4 1019488 144576 ? S 14:32 0:22 php-fpm: pool www

nginx 28808 0.5 3.5 1121136 147224 ? S 14:32 0:23 php-fpm: pool www

nginx 28812 0.5 3.4 1015004 143844 ? S 14:32 0:23 php-fpm: pool www

nginx 28900 0.5 3.6 1112112 151884 ? S 14:37 0:23 php-fpm: pool www

root 29402 0.0 0.3 59020 14764 ? Ss Jan05 0:00 nginx: master process /usr/sbin/nginx -c /etc/nginx/nginx.conf

nginx 29421 0.0 0.3 59024 15012 ? S 15:05 0:02 nginx: worker process

nginx 29422 0.0 0.3 59024 15020 ? S 15:05 0:01 nginx: worker process

nginx 29423 0.0 0.3 59024 14996 ? S 15:05 0:00 nginx: worker process

nginx 29424 0.0 0.3 59024 15008 ? S 15:05 0:00 nginx: worker process

root 29959 0.0 0.0 6384 680 pts/0 R+ 15:44 0:00 grep nginx
This is pretty useful, but not the best when you want to sort by CPU usage. Here is where top command becomes handy:
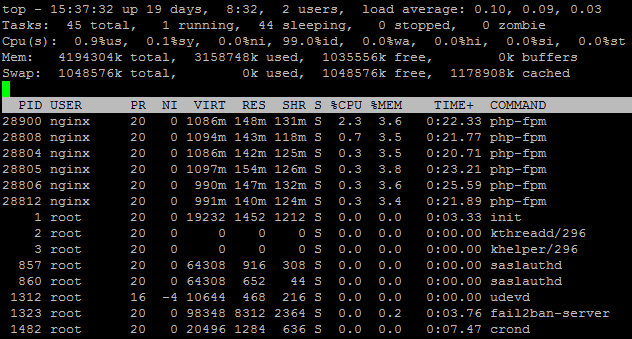
You can see clearly which processes use the most CPU resources (you can also sort by memory usage or execution time). Much better!
But wait, it gets even better! If you want to see the CPU usage in a slightly improved manner (more colors, per CPU core usage bars, memory usage bar) you can use the htop command:
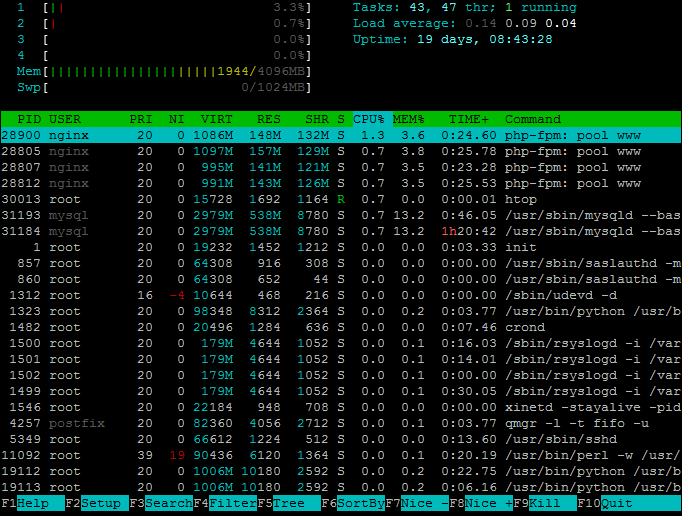
Please note that by default, the htop command is not available on all distributions, but you can install it, for example, on CentOS using yum from RPMforge: yum install htop.